Cargando...
Recursos educativos
-
Nivel educativo
-
Competencias
-
Tipología
-
Idioma
-
Tipo de medio
-
Tipo de actividad
-
Destinatarios
-
Tipo de audiencia
-
Creador
Lo más buscado
- Lecturas comprensivas para imprimir
- Integrales
- juegos de matemáticas para niños
- Julio Cortázar
- Juegos experimentos
- Mickey Mouse
- Guía interactiva de minerales
- Letras J
- Múltiplos y súbmultiplos
- Ejercicios escolares para niños de 10 años
- Juegos matemáticos
- Lógica
- Capilla Sixtina
- Repaso de la multiplicación
- Actividades artisticas
-

CSS chart generator
Tiching explorer Organización
- 1 lo usan
- 3324 visitas
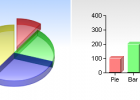
CSS Chart Generator is a web-based tool that allows us to create bar charts quickly. We enter the data and get a link to display the chart on our blog or webpage.
-
Website: ChartGo
Tiching explorer Organización
- 1 lo usan
- 2918 visitas
This tool allows us to create bar graphs, line graphs or pie charts. We choose the settings, paste our data in the chart data area, and hit the create button.
-

Website: Cacoo
Tiching explorer Organización
- 1 lo usan
- 2612 visitas
This website provides an online drawing tool that allows us to create a variety of diagrams (site maps, wire frames, UML and network charts). It's free but we need to register before using it.
-
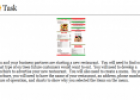
Webquest: Create your own restaurant
Tiching explorer Organización
- 2 lo usan
- 2463 visitas
The main task of this webquest is to create a brochure to advertise a new restaurant. We work cooperatively to collect data and create charts that show what future customers want.
-

Website: Hohli
Tiching explorer Organización
- 1 lo usan
- 2328 visitas
It is a free web-based service that allows us to create line graphs, Venn diagrams, 3D pie charts, bar graphs, radar graphs and some other types of info graphics.
-
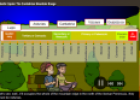
The Cantabrian coast
Proyecto Agrega Organización
- 3 lo usan
- 1928 visitas
Lesson designed to help us learn about the main characteristics of the Atlantic ecosystems. We learn about the processes of soil formation. We practice using geography vocabulary correctly. We read maps…
-

Website: PieColor
Tiching explorer Organización
- 1 lo usan
- 1714 visitas
This website provides a tool that creates color pie charts. We enter number of slices and label all the values, and it generates an image, which we can then download and share on the Internet.
-
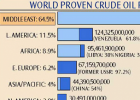
Oil, Coal, and Gas Reserves, Peak Oil, Global Energy Use Statistics - Earth
V&V Books Vicens Vives Organización
- 742 visitas
Key charts and statistics about the world's supply of energy resources, world energy use, energy use in the United States, and the effects and causes of peak oil production.
-

Population of Europe
Esdres Jaruchik Organización
- 505 visitas
Europe Population: current, historical, and projected population, growth rate, immigration, median age, total fertility rate (TFR), population density, urbanization, urban population, country's…
-

Tutorial Excel 2010
Tiching explorer Organización
- 31 lo usan
- 5228 visitas
This set of lessons covers the basics of Excel: modifying cells, rows and columns, creating formulas, sorting and filtering data, reviewing and sharing workbooks charts, sparklines, etc... There are…


Te estamos redirigiendo a la ficha del libro...
