Cargando...
Recursos educativos
-
Nivel educativo
-
Competencias
-
Tipología
-
Idioma
-
Tipo de medio
-
Tipo de actividad
-
Destinatarios
-
Tipo de audiencia
-
Creador
Lo más buscado
-

Website: Chartle
Tiching explorer Organización
- 1 lo usan
- 5854 visitas
Thiis website provides a tool that allows us to create charts, maps, plots and diagrams.
-
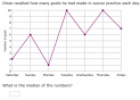
Statistics
Tiching explorer Organización
- 3008 visitas
Set of activities in which we create and interpret charts to find mean, median, mode, and range.
-

Interpret. Energy production and consumption in Spain
EduBook Organización
- 2082 visitas
Look at the graph for 2009. Use the pie charts to analyse Spain's energy output and consumption:
-

Learn. Reading graphs
EduBook Organización
- 1949 visitas
Graphs and charts are helpful tools in geography because they provide us with a lot of information very quickly. It is very important to be accurate and precise when reading a graph, and to explain as…
-
Introduction to Microsoft Excel
e-Learning for Kids Organización
- 5 lo usan
- 7474 visitas
This resource is a Microsoft Excel course. We learn how to edit, use formulas, use charts, and use the print option.
-

Poll Everywhere
Emilio Rosico Docente
- 3072 visitas
Audience response system that uses mobile phones, twitter, and the web. Responses are displayed in real-time on gorgeous charts in PowerPoint, Keynote, or web browser.
-
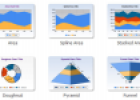
Website: DIY chart builder
Tiching explorer Organización
- 1 lo usan
- 3222 visitas
DIYchart is a web-based tool that allows us to create interactive charts and graphs from static or dynamic data. It's free but we need to register first.
-

Vacation
Tiching explorer Organización
- 3469 visitas
Activity designed to help us learn how to use charts to analyze information and plan a vacation. We practice vocabulary related to holidays, hotels and travelling.
-
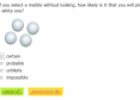
Probability and statistics
Tiching explorer Organización
- 3987 visitas
Set of activities designed to help us learn about probability (certain, probable, unlikely, and impossible). We interpret charts to find mean, median, mode, and range.
-
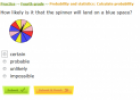
Calculate probability
Tiching explorer Organización
- 3687 visitas
Set of activities designed to help us learn about probability.We make predictions. We interpret charts to find mean, median, mode, and range.
Te estamos redirigiendo a la ficha del libro...


