Cargando...
Recursos educativos
-
Nivel educativo
-
Competencias
-
Tipología
-
Idioma
-
Tipo de medio
-
Tipo de actividad
-
Destinatarios
-
Tipo de audiencia
-
Creador
Lo más buscado
- Animales dibujados
- Experimentos de ecología
- Juegos de tangram de figuras
- Palabras agudas, llanas y esdrújulas
- Rios de Asia
- Reported speech
- Actividades de lenguaje para primaria
- Aprender a multiplicar
- Juegos geográficos
- Desarrollo emocional adolescencia
- Repaso del adjetivo
- Repaso de lengua castellana
- Actividades día de la paz
- Actividades artísticas para niños
- Letras E
-

Website: Crappy graphs
Tiching explorer Organización
- 1 lo usan
- 2093 visitas
This is a web-based application that permits us to create coloured graphs and Venn diagrams. Once we finish, we can save our graph and you we sent a link to see it whenever we like on the site.
-

Interpret. Climate chart for Leitariegos
EduBook Organización
- 2122 visitas
Look at the graph and answer the questions: What is the average temperature in the hottest month? And in the coldest month? In which month does it rain the most? And the least?
-

Interpret. Climate chart for Malaga
EduBook Organización
- 2117 visitas
Look at the graph and answer the questions: What is the average temperature of the hottest month in Malaga? In which month does it rain the most? And the least?
-

Interpret. Main rivers of the Atlantic watershed
EduBook Organización
- 2071 visitas
Look at the graph and answer the questions. Which is the shortest river in the Atlantic watershed? Are the rivers that cross the Meseta longer than the Andalusian and Galician rivers?
-

Interpret. Internet and social networks users
EduBook Organización
- 2058 visitas
Look at the graph and answer the question: Which continent has had the greatest increase in users since 2000? How can you explain this? Calculate the increase in users in Europe.
-

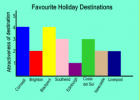
Favourite holiday destinations
Smart Organización
- 1830 visitas
In this activity we investigate the appeal of different holiday destinations. The activity involves recording data, developing a graph, accessing the internet and preparing a report on a selected…
-

Look and answer. Spain's labour force by sector in 2007
EduBook Organización
- 1801 visitas
Look at the graph and answer the questions: In which sector does most of the population work? Give some examples of jobs in this sector. In which sector do the fewest people work? What activities do they do?
-

Look and answer. Institutions of the Spanish state
EduBook Organización
- 1589 visitas
Look at the graph and answer the questions: What are the main institutions of the Spanish state? What powers do they exercise? Who elects the parliament? And the president? Who chooses the ministers?…
-

Interpret. Immigrants employed in Spain in 2009
EduBook Organización
- 1582 visitas
Look at the graph and answer the questions: What percentage of people has some level of education? What percentage has a degree in higher education? Are any of these statistics surprising?
-

Interpret. The EU budget
EduBook Organización
- 1593 visitas
Look at the graph and answer the questions: How much of the EU budget in 2011 went to agriculture? Why does the EU give so much importance to agriculture?
Te estamos redirigiendo a la ficha del libro...


